US staffing hours continue slow, steady climb since July 4th
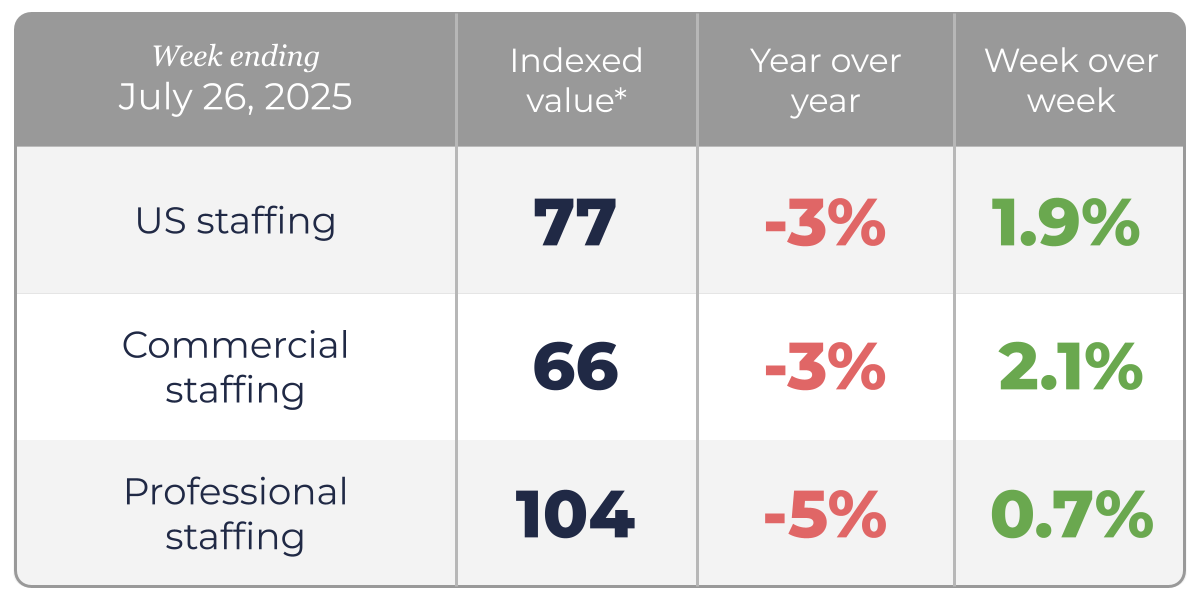
US staffing hours were up 1.9% compared to the previous week. Commercial hours saw the biggest increase, up 2.1% compared week over week. Professional staffing hours saw a smaller improvement, rising .7% week over week.
**Indexed value of US staffing hours benchmarked against the week ending January 19, 2019.
Staffing Industry Analysts' perspective
The Professional Staffing indexed value was 104 for the week ending July 26th, following readings of 103 and 100 in the prior two weeks (ending July 19th and July 12th, respectively.)
The Commercial Staffing indexed value was 66 for the same week, following values of 65 and 62 in the prior two weeks.
The US Staffing indexed value, weighted to reflect the US staffing industry mix of professional and commercial jobs, was 77 for the week ending July 26th, following readings of 75 and 72 in the prior two weeks, as shown in the interactive chart above.
The US staffing industry is a large and dynamic market that continues to offer big opportunities
US Staffing hours fell by -3% compared to the same week a year ago, marking a widening of the year-on-year gap from -2% and 0% seen in the prior two weeks (ending July 19th and July 12th, respectively). Commercial staffing hours were down -3% while Professional staffing hours were down -5%.
Nevertheless, hours worked in the US Staffing Industry for the week ended July 26th were at the highest level seen this year, surpassing the levels reached in February and March.
Through the first seven months of this year, commercial staffing has shown a trend of slight growth. In contrast, professional staffing levels have edged down slightly during this same period. The year-over-year gap for Commercial staffing narrowed throughout the first half of the year, however hours in the second half of July indicate a slight widening of the year-over-year gap. Professional Staffing’s year-over-year gap increased to mid-single digits in the second half of July, returning to the trend seen from March to June this year.
Despite the slight widening of the year-over-year gap in hours in the second half of July mentioned above, data we published in the August 2025 US Jobs Report (published on August 1st), suggests that US temporary help employment appears to be trending towards flat Y/Y comparison, although it still remained down 2.8% Y/Y in July. Although fears of recession related to trade policy have significantly eased, nonfarm payroll growth has trended lower since January, matching with other signals of a consistently but gradually softening labor market. In total, given the current climate of heightened uncertainty in the short to medium term, staffing companies may have an enhanced value proposition by offering their clients a flexible workforce to navigate today’s business environment.
About the SIA Bullhorn Staffing Industry Indicator
The SIA | Bullhorn Staffing Indicator is a unique tool for gauging near real time weekly trends in the volume of temporary staffing delivered by US staffing firms. Each week the Indicator reports data for the week that ended ten days prior to the release. It reflects weekly hours worked by temporary workers across a sample of staffing companies in the US that utilize Bullhorn’s technology solutions. The Indicator is weighted and benchmarked against US Bureau of Labor Statistics data to approximate the composition of the staffing industry by skill. While the indicator does not presume to perfectly reflect the entire universe of US staffing firms, it does represent a sizable sample of the US staffing industry, reflecting a wide range of occupations, client industry verticals, and geographic footprint that spans the country.
The Indicator can be used by staffing firms to benchmark their past and current performance, as well as a tool for forecasting near term industry trends and outlook.
As the US temporary staffing industry has often functioned as a co-incident indicator for the US labor market and economy, the SIA | Bullhorn Staffing Indicator is also useful for a broader audience of business leaders and investors who are seeking real-time insight.
The Indicator is a joint custom research effort between Bullhorn and industry advisor Staffing Industry Analysts.
Revisions and Technical notes on the SIA | Bullhorn Staffing Indicator
We note the readings for the last 4 weeks are subject to revision and so should be viewed as preliminary, with the reading for the last recorded week the most likely to be revised in next week’s data release. For further information on how the Indicator has been created and detailed technical notes please refer to the methodology.
Want to stay up to date on US temporary staffing trends?
